



September 9, 2026
How Can a Fibonacci Setup Scanner Help Identify Trading Opportunities?
A Fibonacci Setup Scanner is a trading tool designed to help traders identify market setups around important Fibonacci levels. Traders commonly use Fibonacci retracement and extension levels to study potential support, resistance, entry, and target areas.
Instead of manually checking multiple charts, a scanner can monitor markets and highlight assets that meet selected Fibonacci conditions. This saves time and helps traders focus on opportunities that match their strategy.
Fibonacci levels often include 23.6%, 38.2%, 50%, 61.8%, and 78.6% retracement zones. Among these, the 38.2% and 61.8% levels receive significant attention because traders frequently use them when analyzing price pullbacks.
A scanner does not predict the future. Instead, it organizes market information and points traders toward situations that deserve closer analysis.
How Does Fibonacci Analysis Help Traders Find Opportunities?
Fibonacci analysis works by measuring a significant price movement and identifying possible retracement or extension areas. For example, when an asset moves strongly upward, a trader may use Fibonacci retracement levels to estimate where a temporary pullback could find support.
A Fibonacci Setup Scanner can automate much of this process. It can scan charts for price interactions with selected Fibonacci levels and present potentially interesting setups.
This approach becomes especially useful when traders follow many stocks, forex pairs, cryptocurrencies, or other financial instruments. Manually drawing Fibonacci levels across every chart can take considerable time. A scanner can narrow the watchlist so traders can spend more time evaluating market conditions.
What Features Should You Look for in a Fibonacci Setup Scanner?
A useful scanner should provide clear and practical information rather than simply producing a large number of alerts. Traders should consider several features before choosing a scanning tool.
Multi-Timeframe Analysis
Markets behave differently across timeframes. A setup that looks attractive on a five-minute chart may look weak on a daily chart.
A good scanner should allow traders to examine different timeframes. This helps users compare short-term signals with broader market trends.
Custom Fibonacci Levels
Different trading strategies rely on different Fibonacci ratios. A flexible scanner should allow traders to select the levels they want to monitor.
Customization helps traders create scans that fit their existing strategies instead of forcing them to follow a fixed setup.
Clear Alerts
Too many alerts can create unnecessary noise. A scanner should present signals in a simple format and explain what condition triggered the alert.
Clear alerts allow traders to quickly identify the asset, timeframe, Fibonacci level, and relevant price action.
Historical Testing
Backtesting can help traders understand how a particular setup performed under previous market conditions. Although past performance does not guarantee future results, historical testing can reveal weaknesses and strengths in a strategy.
Why Is a Non-repainting Fibonacci Scanner Important?
A Non-repainting Fibonacci scanner is designed to avoid changing historical signals after new market data becomes available. This distinction matters because traders need reliable historical information when evaluating a strategy.
Some technical indicators can appear highly accurate when viewed after the fact because previous signals change as the chart develops. This can make a strategy look better in hindsight than it actually performed in real time.
A non-repainting approach aims to preserve signals according to the rules and information available at the time. This can make backtesting and live evaluation more meaningful.
However, traders should still understand how the scanner calculates its Fibonacci anchors. No indicator can remove market uncertainty, and even a non-repainting scanner cannot guarantee profitable trades.
How Can Traders Combine Fibonacci Signals With Price Action?
Fibonacci levels work best when traders use them as part of a broader analysis process. A scanner may identify a potential setup, but the trader should examine price behavior before making a decision.
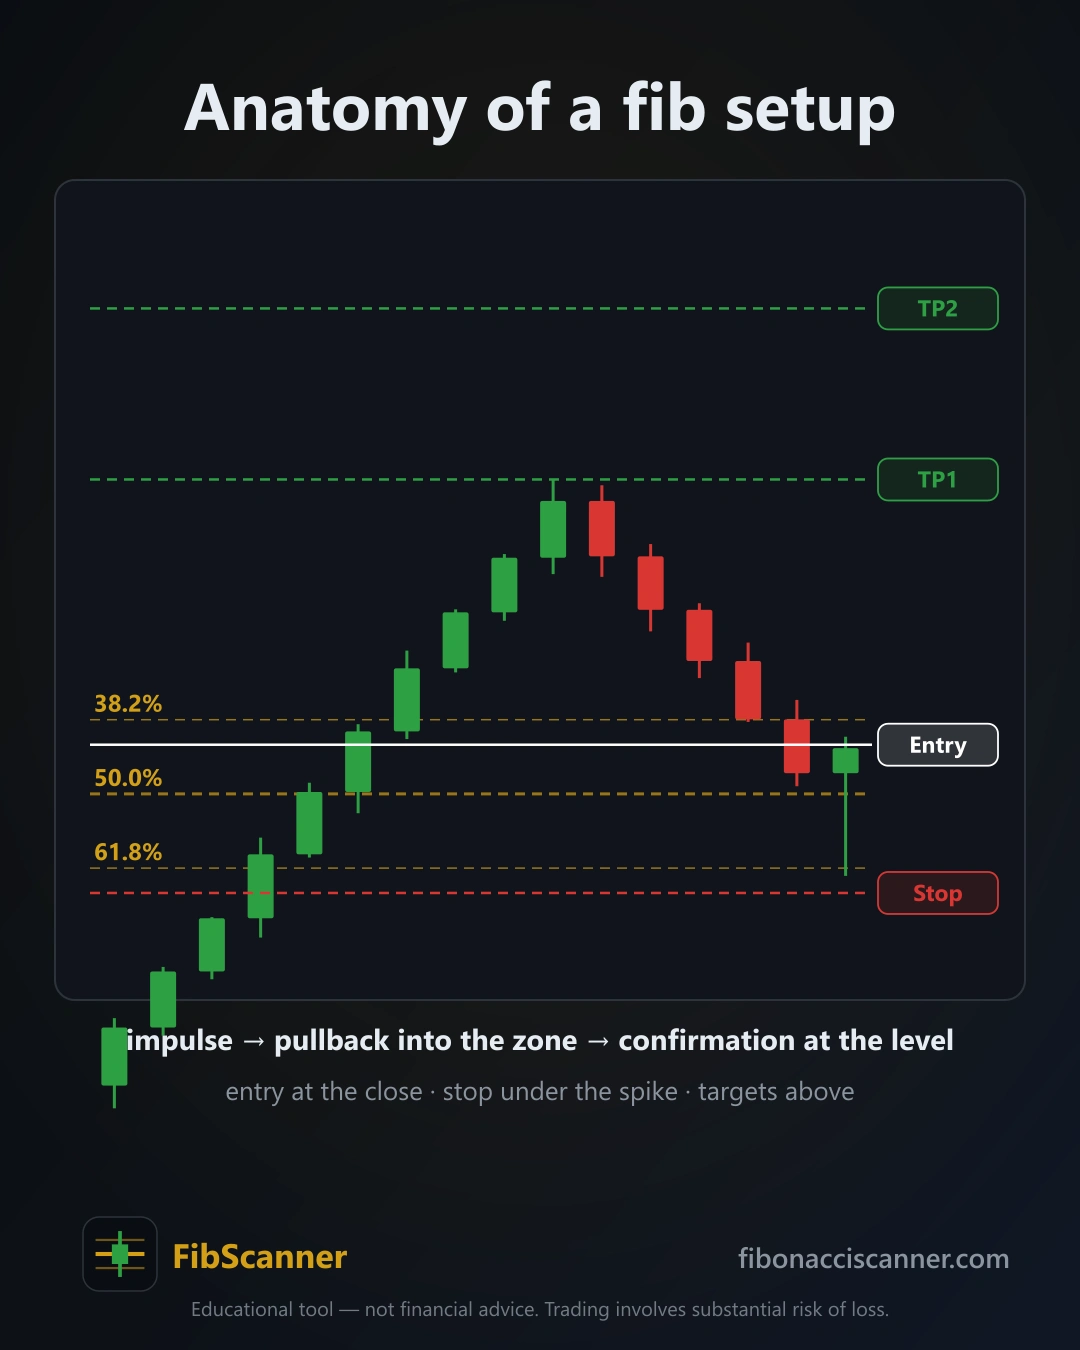
For example, suppose an asset retraces toward the 61.8% Fibonacci level. A trader could then look for signs such as a rejection candle, bullish reversal pattern, increased volume, or a break of a nearby resistance level.
The Fibonacci level provides an area of interest, while price action can provide additional confirmation.
Traders can also examine market structure. Higher highs and higher lows may support a bullish setup, while lower highs and lower lows may indicate bearish conditions.
This combination can reduce the risk of treating every Fibonacci touch as an automatic trading signal.
Can a Fibonacci Setup Scanner Help With Entry and Exit Planning?
Yes, a scanner can help traders organize potential entry and exit areas. Fibonacci retracement levels may highlight zones where a pullback could pause, while Fibonacci extensions can help traders estimate possible profit targets.
For example, a trader might identify a potential entry near a retracement level and then consider a previous swing high as an initial target. Extensions can provide additional reference points if the price continues in the expected direction.
Risk management remains essential. Traders should define where their analysis becomes invalid before entering a position. A stop-loss level can help limit losses when price moves against the setup.
The scanner should therefore support a structured decision-making process rather than encourage impulsive entries.
How Can a Scanner Reduce the Time Spent on Market Analysis?
One of the biggest benefits of automated scanning is efficiency. Traders often monitor dozens or hundreds of instruments. Checking each chart manually can make it difficult to maintain a consistent process.
A scanner can continuously search for predefined conditions and create a focused watchlist. Instead of asking, “Which chart should I check next?” traders can begin with markets that already meet their selected criteria.
This can be particularly valuable for swing traders and active traders who use technical setups across multiple instruments.
Automation also promotes consistency. When traders manually search for setups, emotions and personal preferences can influence which charts they select. A rule-based scanner applies the same criteria across the selected market universe.
What Mistakes Should Traders Avoid When Using Fibonacci Scanners?
A scanner can improve the research process, but it cannot replace sound trading judgment. One common mistake involves taking every scanner signal without additional confirmation.
Another mistake is placing too much importance on a single Fibonacci ratio. Markets rarely respect technical levels perfectly. Price can move through a Fibonacci zone before reversing or continue moving without reacting at all.
Traders should also avoid overfitting their scanner settings to historical data. A strategy can appear excellent in backtests while performing poorly in changing market conditions.
Finally, traders should maintain proper position sizing and risk controls. A strong-looking technical setup can still fail.
How Can Traders Build a Better Fibonacci Trading Workflow?
A practical workflow can begin with market scanning. The trader can use the scanner to identify instruments approaching important Fibonacci zones.
Next, the trader can review the broader trend and market structure. After that, price action, volume, volatility, and nearby support or resistance can provide additional context.
The trader can then define an entry trigger, stop-loss location, and potential target before taking a position. Recording each trade can help identify which setups perform well and which conditions lead to poor results.
Using a tool such as Fibonacci Scanner can make this process more organized when traders combine automated scanning with disciplined analysis.
Is a Fibonacci Setup Scanner Suitable for Every Trader?
Not necessarily. Fibonacci tools are most useful for traders who already understand technical analysis and want to automate part of their chart-screening process.
Beginners should first learn how Fibonacci retracements and extensions work before relying heavily on automated signals. Experienced traders may use scanners to speed up their existing strategies and monitor larger groups of instruments.
The best approach depends on the trader’s timeframe, market, risk tolerance, and trading methodology.
What Is the Best Way to Use a Fibonacci Setup Scanner?
The most effective approach is to treat the scanner as a market research and filtering tool, not as an automatic trading system. Start with clearly defined Fibonacci conditions, scan multiple instruments, and then manually evaluate the strongest candidates.
A Non-repainting Fibonacci scanner can be especially useful when traders want to study historical signals without relying on changing chart information. Combining those signals with market structure, price action, volume, risk management, and broader market context can create a more balanced trading process.
Ultimately, technology can make chart analysis faster, but traders still need a clear plan. A scanner can identify potential opportunities; disciplined analysis determines whether those opportunities actually fit the trading strategy.