




September 30, 2026
How Do Fibonacci Levels Help Identify Breakout Setups?
Breakouts can create some of the most interesting opportunities in financial markets, but identifying a genuine breakout requires more than watching price move beyond support or resistance. Traders often combine technical tools to understand whether a move has momentum and where a potential entry or exit area may develop. Fibonacci and Breakout Setups can work together by helping traders map retracement levels, identify important price zones, and plan trades around potential continuation moves.
Fibonacci retracement levels come from a sequence that traders use to divide a price range into commonly watched percentages. Levels such as 23.6%, 38.2%, 50%, 61.8%, and 78.6% are frequently displayed on charts. When these levels overlap with previous support, resistance, trendlines, or breakout zones, they can provide additional technical context.
What Are Fibonacci and Breakout Setups?
A breakout occurs when price moves beyond a clearly established support or resistance area. Traders may watch the move for signs that buyers or sellers are gaining control. However, price can also move temporarily beyond a level and then return to the previous range. This situation is commonly called a false breakout.
Fibonacci and Breakout Setups use Fibonacci levels alongside price structure to examine what happens before, during, and after a breakout. Instead of treating a Fibonacci level as a guaranteed signal, traders can use it as a reference point for assessing market behaviour.
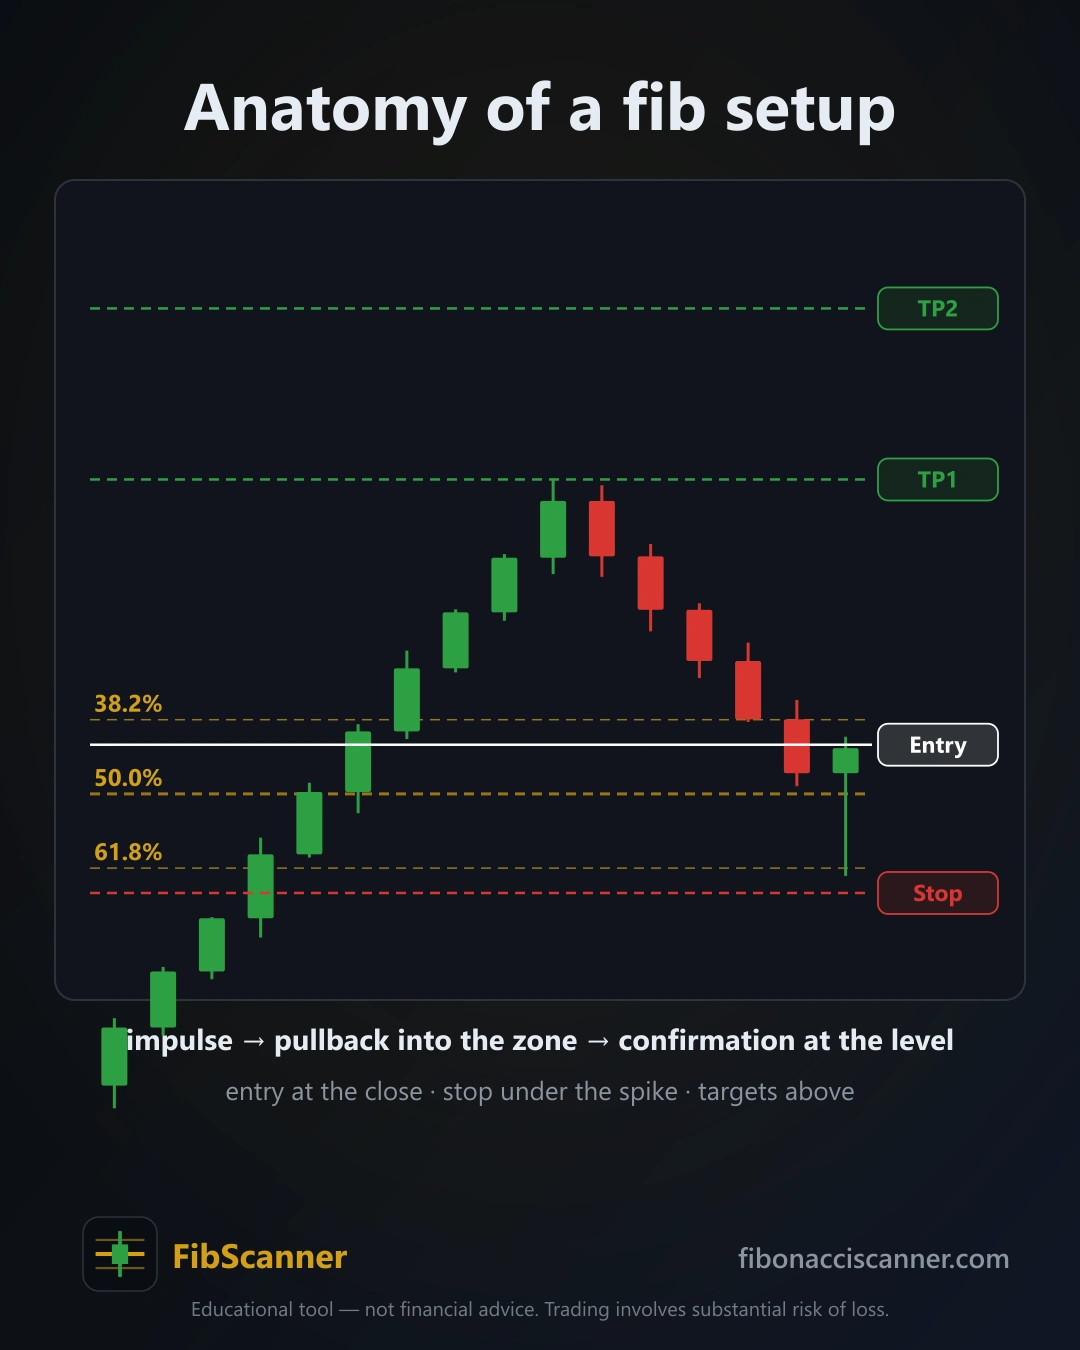
For example, after a strong upward move, a trader may draw Fibonacci retracement levels from a recent swing low to a swing high. If price pulls back toward the 38.2% or 61.8% area and then approaches a previous resistance level, the combination can create a zone worth monitoring.
How Do Fibonacci Levels Highlight Potential Breakout Zones?
Fibonacci levels can help traders identify areas where price may pause or react. A breakout setup becomes more interesting when a Fibonacci level aligns with an existing technical area.
Suppose an asset has repeatedly struggled to move above a particular resistance level. After a strong upward movement, price retraces and finds support near a Fibonacci level. If buyers later push price above the resistance zone with increased momentum, traders may consider the Fibonacci support and resistance breakout together rather than analysing either signal separately.
This approach creates a structured chart-reading process. Traders can identify the original trend, measure the retracement, mark important horizontal levels, and then observe whether price confirms a breakout.
Can Fibonacci Retracement Levels Confirm a Breakout?
Fibonacci retracement levels do not technically confirm a breakout by themselves. Instead, they can provide supporting information.
Confirmation may come from factors such as:
- A decisive candle closing beyond resistance
- Stronger trading volume where volume data is available
- Continued price movement after the initial breakout
- A successful retest of the broken resistance
- Alignment with the broader market trend
- Price holding above an important Fibonacci area
For example, if price breaks above resistance and then returns to test that level without falling back into the previous range, the retest can provide additional context. If that area also matches a Fibonacci retracement level, traders may pay closer attention to the price action.
How Can the 38.2% and 61.8% Levels Support Breakout Analysis?
The 38.2% and 61.8% Fibonacci levels are widely followed by technical traders. Their usefulness comes from their ability to provide consistent reference points across different charts and markets.
A shallow retracement toward 38.2% can indicate that price has pulled back only modestly after a strong move. A deeper retracement toward 61.8% may show a more substantial correction.
Neither level guarantees that price will reverse. Instead, traders can observe how price behaves around these zones. If a potential breakout forms after price respects a Fibonacci level, the level can become part of the broader technical setup.
What Role Does a Fibonacci and Breakout Scanner Play?
Manually monitoring multiple cryptocurrency and forex charts can take considerable time. A scanning tool can help traders identify charts that meet selected technical conditions.
A Crypto and forex scanner extension may help users monitor markets for patterns involving price movement, technical levels, or breakout conditions. Depending on the features available, traders may use scanning tools to narrow down a large market into a smaller list of charts for further analysis.
For instance, a scanner may identify an asset approaching a resistance level while another chart may show a recent breakout followed by a retracement. The trader can then open the chart and examine the Fibonacci structure manually.
Tools such as Fibonacci Scanner can fit into this type of workflow by helping traders organize their technical analysis and focus attention on relevant market conditions.
How Can Traders Combine Fibonacci With Support and Resistance?
Fibonacci becomes more useful when traders combine it with established price structure. A Fibonacci level that appears in isolation may not provide much context. However, when it overlaps with a previous support or resistance zone, it can become a more noticeable area on the chart.
Consider a market that breaks above resistance and then begins to retrace. If the broken resistance and a 50% Fibonacci level are close together, traders can watch how price reacts in that region.
A strong reaction may provide additional information, while a decisive move back below the area could weaken the breakout structure. This method encourages traders to analyse price behaviour rather than relying on a single indicator.
Why Is the Breakout Retest Important?
A retest can provide valuable information about whether a breakout level is holding. After price moves beyond resistance, it may return toward the original breakout area. Traders can observe whether buyers or sellers defend that zone.
When the retest also occurs near a Fibonacci level, the setup may offer several technical reference points. For example, traders can monitor the previous resistance, Fibonacci percentage, candlestick behaviour, and overall trend simultaneously.
However, a retest can fail. Price may return inside the previous range, which demonstrates why traders should consider risk management rather than assuming every breakout will continue.
How Can a Crypto and Forex Scanner Extension Improve Market Monitoring?
Cryptocurrency and forex markets can contain numerous instruments and multiple timeframes. Checking every chart manually can make it difficult to maintain a consistent process.
A Crypto and forex scanner extension can help streamline the initial screening process. Instead of searching randomly, traders can use available scanning conditions to locate assets showing particular technical characteristics.
The scanner should serve as a research and monitoring tool rather than an automatic decision-maker. Traders still need to review the chart, market conditions, timeframe, volatility, liquidity, and risk before acting.
How Can Traders Build a Practical Fibonacci Breakout Process?
A simple process can make Fibonacci-based breakout analysis easier to follow:
- Identify the broader market trend.
- Mark major support and resistance levels.
- Select a clear swing high and swing low.
- Apply Fibonacci retracement levels.
- Look for areas where Fibonacci levels overlap with price structure.
- Monitor potential breakout behaviour.
- Wait for price confirmation or a retest where appropriate.
- Define risk before entering a trade.
- Review the setup across suitable timeframes.
- Record the outcome to improve future analysis.
This process helps prevent traders from treating Fibonacci levels as standalone signals.
Can Fibonacci Levels Improve Breakout Decision-Making?
Fibonacci levels can add structure to breakout analysis by highlighting potential retracement and reaction zones. When combined with support, resistance, price action, volume, and trend analysis, they can give traders a more organized framework for studying potential setups.
The key is to treat Fibonacci as a technical reference rather than a prediction tool. Markets can move unexpectedly, and no indicator can guarantee that a breakout will succeed.
For traders who monitor multiple markets, Fibonacci Scanner can also support a more systematic approach to finding charts that deserve closer attention. By combining scanning technology with disciplined chart analysis and risk management, traders can evaluate Fibonacci and Breakout Setups with greater consistency.